In location marketing, we take a user’s location data—where someone goes throughout their day—and use mobile ads to influence what they do next. As an example, retargeting consumers who visited your store before is a powerful tactic often using in location marketing. However, marketing tactics often need performance at scale, and thus need to reach additional consumers beyond the retargeting audience set. An alternate solution is to predict if a specific consumer is likely to visit a store, even if the same consumer was not observed visiting that store or similar stores before. In this post, we will walk through how we use offline data to build a system which predicts the likeliness of a user visiting a particular place in the near future. The prediction is now used by our ad server’s optimization engine and consistently delivers ~50% increase in Visit Rate (VR), the rate at which a user visits a store after seeing an ad, for advertisers running marketing campaigns on our platform. We’ll mainly focus on feature engineering, and plan to expand further on modeling in a future blog.
Feature Engineering:
It turns out that humans are pretty predictable. What we do, where we spend time, how we move—all of these are specific to oneself and also dictate our real-world propensities. As an example, how many times have you traveled more than 2 miles to visit a store? For Ikea, maybe every time. For Taco Bell, maybe never. Thus, distance from the neighborhood in which you live or work is a big predictor of the likeliness of you visiting a specific store, and a perfect feature to explore. Below are some examples of the features that we explored: A user’s store visitation features
- A user’s frequency and recency of visitation to a relevant brand and other brands.
- This signifies how frequently and how long ago a user visited relevant stores.
A user’s geo-cluster
- Geo-clusters refer to the region where a user spends 80% of his/her time.
- If a specific store is outside a user’s geo-cluster, a user is not likely to be influenced to go to that store. For example, if someone never goes to the Upper East Side in Manhattan, the user is likely not going to be influenced to go visit a store in that area.
Neighborhoods that a user dwells in
- Neighborhoods have certain attributes and exhibit a user’s propensity toward a brand. If a user lives in a neighborhood with a high propensity to a particular brand, that user is likely to be influenced to go visit the brand’s store.
- For more info on Neighborhoods, read through a foot traffic analysis we did last year which showed that more users from middle-income neighborhoods started going to Whole Foods after Amazon’s acquisition. See below figure.
Figure 1: Shows that middle-income neighborhoods started visiting Whole Foods more often after Amazon acquired Whole Foods and lowered prices of some staple items. Toggle from left to right to see the changes in visitation. User graph features – This includes feature values of a user’s inferred connections (friends, colleagues, etc.).
- This is an exploratory field for us. It uses a location-based user graph (much like a social graph) to determine where there exists a high probability of connection amongst users and hinges on the hypothesis that people connected together usually have similar consumption patterns.
And others
- Brand’s popularity. Example, new users are statistically more likely to visit a Walmart than a restaurant chain.
- User’s current location. Example, is the user on road, in a commercial place, etc.?
- Plus, quite a few more!
A few important observations from above:
- Identifying features requires domain expertise.
- Feature selection is difficult.
- During the feature selection process, a lot of the above features turned out to be redundant.
- Feature preparation is time-consuming. For example, finding a user’s geo-cluster itself required a model.
- Fewer features often lead to better models.
- In our opinion, machine learning is basically all about feature engineering.
We eventually settled on a subset of the above. User-specific attributes, such as the distance between a user’s current or historic location and the nearest store, ended up having the highest predictive power.
Modeling:
After feature engineering, the team jumped into modeling. There are a lot of things we iterated on—identifying the best model, hyperparameter tuning, making tough decisions on precision vs. recall, etc. For this case, we chose a random forest classifier. Eventually, the Predicted VR and the True VR were proportional to each other. Below is a quick data point to highlight the same. 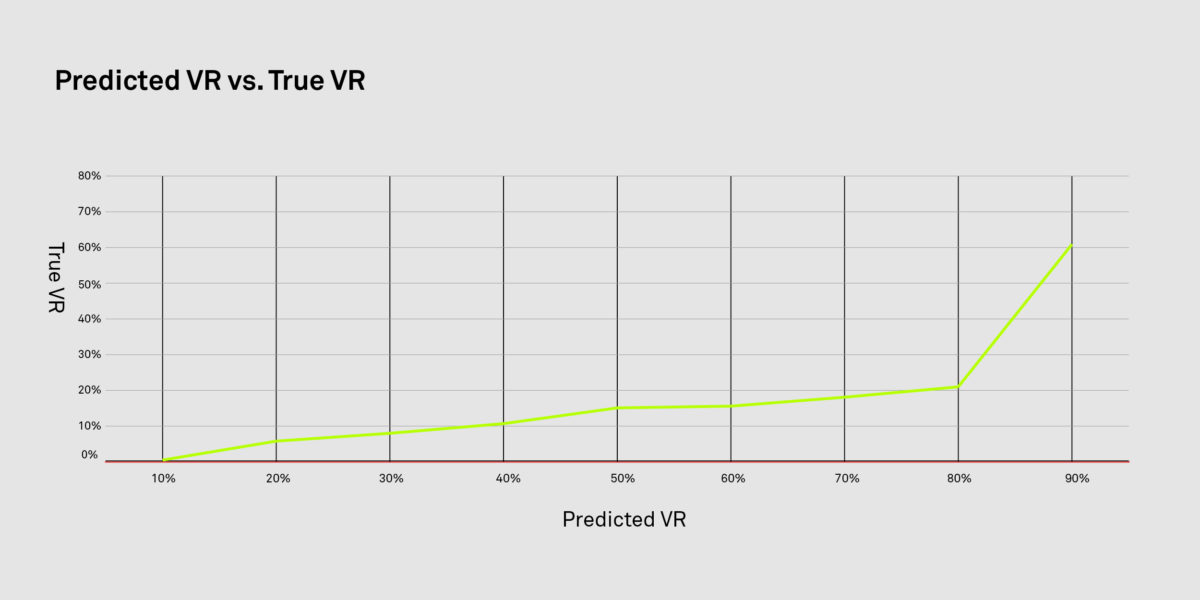 Figure 2: Shows that the Predicted VR and True VR have an almost linear relationship. In simple words—this means that the model has good predictive power.
Applying The Model to Ad Serving:
Once we had predictions from the model, it was time for us to apply this in our ad serving. We implemented what we call as ‘ differential bidding.’ Essentially, differential bidding is a simple three-step process performed in real-time for every placement:
-
-
- Predict the VR of every qualifying ad request.
- From the predicted VR, find the relative quantile that this ad request falls into when ranked against the most recent 1 million requests within the placement.
- To the existing bid, add a bid multiplier which is proportional to the quantile.
-
Ad requests chosen by ‘differential bidding’ had a higher predicted VR, thus eventually increasing the True VR when the model was applied. See below graph for some bucket testing results. 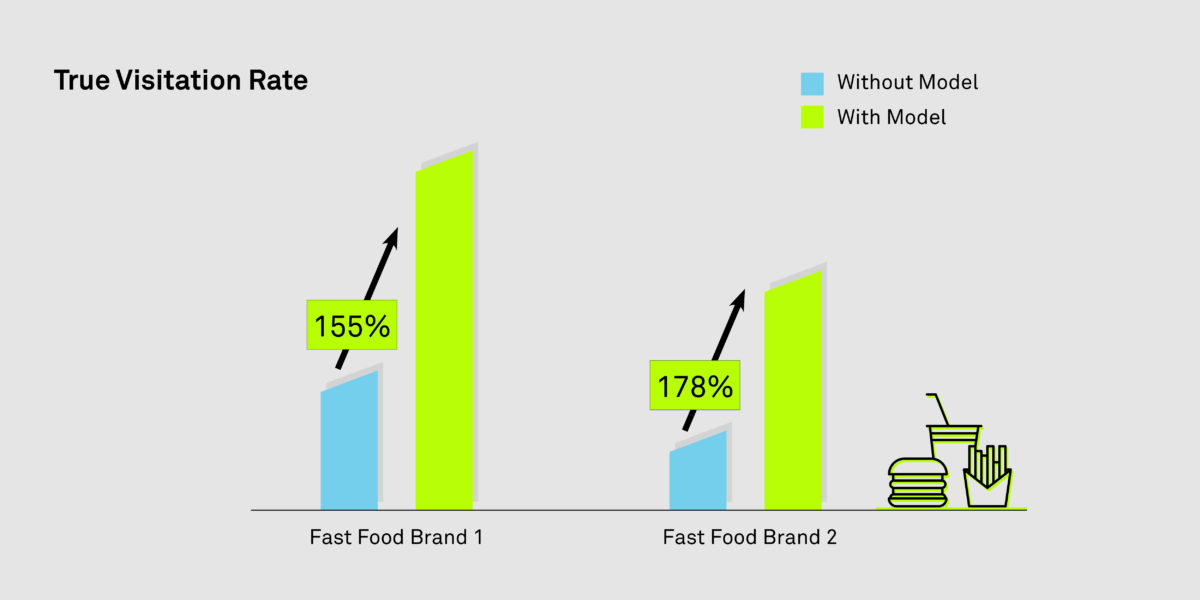 Figure 3: This shows A/B testing results for a couple of placements. Ad requests which were chosen by the bidder had higher True VR (Visit Rate) when the model was switched on vs. when the model was not switched on. Therefore, the overall VR with the model was higher than the overall VR without the model.
Looking Ahead
This optimization is being rolled out in our ad platform and we eventually see this being used across our entire client base. We also collectively feel that this is just scratching the surface. Location data, when used in a privacy-safe and responsible manner, is likely to have substantial implications in marketing and beyond. Interested in working on projects such as above? We are hiring! Please connect with us at groundtruth.com/jobs Special thanks to the following members of the data Science and product team who were involved in this work: Guoxin Li, Alicia Huang, Zepu Zhang.